
Your Attribution Is Wrong. Test Anyway.
Every ad platform reports its own performance, and every one of them reports favorably. This is not fraud. It is a structural consequence of how attribution works: the platform sees an ad impression and a later purchase, and counts the purchase. It cannot see whether the purchase would have happened regardless.
For a channel reaching people who were going to buy anyway, that gap is enormous.
How large the gap can be
A consumer brand increased paid social spend fivefold in five metro areas — from about 7% of total budget to 35% — and measured orders by shipping ZIP code rather than by platform attribution. Test regions' share of sales moved from roughly 10.9% to 12.2%.
A 10% lift against a 500% spend increase. Effectively nothing, on a channel the platform was reporting as profitable.
The same design on a marketplace demand-side platform, at more than ten times the spend in five metros, produced zero lift. Test-geo sales drifted slightly down, within normal variation.
A quick sanity check you can run today
Add up the conversions all your platforms claim for last month. Compare that total to the actual number of new customers you acquired.
If the platforms collectively claim more conversions than you had customers, you know the reporting is inflated and roughly by how much. It is crude, it takes ten minutes, and it is often startling.
Geography is the honest instrument
The clean read is a geographic holdout: change spend in some regions, hold others constant, and measure orders by shipping address or billing ZIP from your own order data. Shipping address does not care what the platform claims.
Run it in both directions. Increasing spend tells you whether more money produces more customers. Cutting spend in a test region is often the more useful test — measure the margin lost against the spend saved, and if the ratio comes in below about 1, the cut spend was losing money and the reduction is itself the win.
One design warning: comparing a test region against the whole rest of the country biases the result. Use matched regions with similar baseline behavior.
When you cannot measure cleanly, raise the bar
Some channels do not permit a clean read, and the temptation is to either trust the platform or abstain from testing. There is a third option.
Where only a dirty measurement exists, set the required return well above your true hurdle. If you need a 2.0 return and the platform over-reports by roughly half, demand 3.0 on the platform's own numbers. Clearing an inflated bar on flattering figures means it works on honest ones.
That is how paid social got tested in one engagement where no incrementality read was available. It cleared the inflated bar, was scaled, and worked. Affiliate needed no such adjustment — attribution there is clean by construction, because affiliates only get paid for sales they can be shown to have caused.
The rule
Do not confuse a platform's report with a measurement. Where you can run geography, run it. Where you cannot, inflate the threshold and proceed. What you should not do is take the dashboard at face value or refuse to test because the measurement is imperfect.
Platform-reported returns credit sales that would have happened anyway. Where you cannot measure cleanly, raise the bar instead of abstaining.
Related Blogs
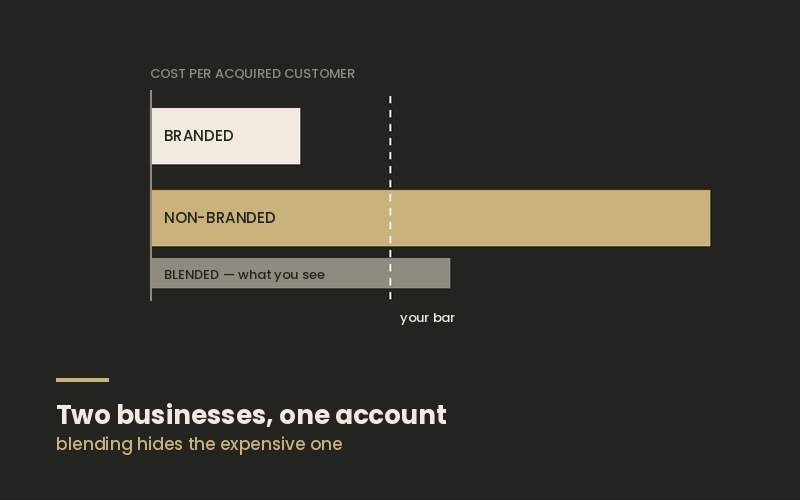
Your Google Ads Account Has Two Businesses In It
Branded and non-branded search are different businesses with different economics, and blending them hides the expensive one.
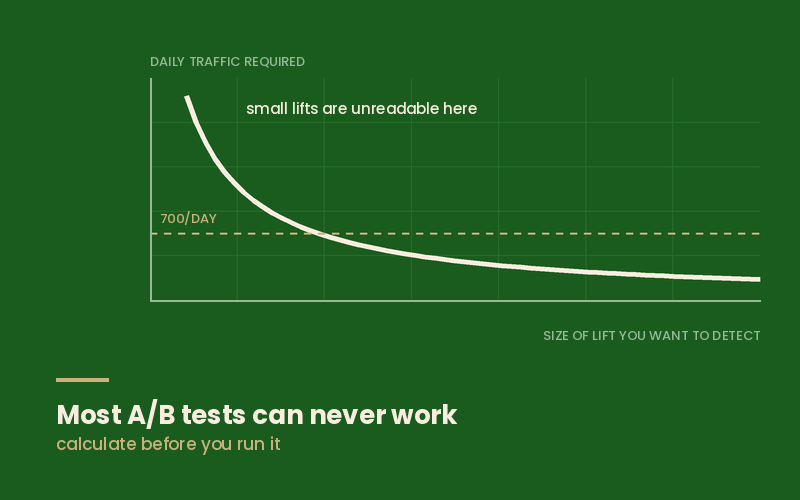
Why Most Website A/B Tests Can Never Work
You can calculate before you start whether a test has enough traffic to produce an answer. Most don't, and they end in "we're not sure."
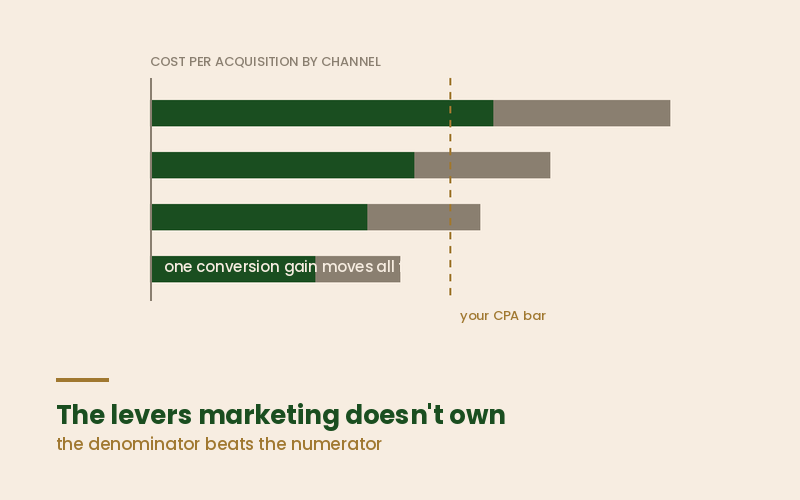
The Conversion Levers Marketing Doesn't Own
The variables with the largest effect on conversion are usually owned by finance or operations, and no one has priced the marketing consequence.
Get in touch
with us
Contact Us